
| rand() |
| a=1:1000;for i=1:1000,a(i)=rand(),end |
| xbasc();for i=1:30,plot2d(a(i),0,0,rect=[-.2,-.5,1.2,.5]),end |
| xbasc();histplot(20,a) |
| xbasc();for i=1:1000,plot2d(a(i),b(i),0,rect=[-1.2,-1.2,1.2,1.2]),end |
| for i=1:1000,a(i)=-1+2*rand()^2,end |
| bool2s(1<=2) |
| bool2s(2<1) |
| sum(c) |
| mean(d) |
| x=2.97:0.02:3.31 |
| de=d(2.97<=d & d<=3.31) |
| xbasc();histplot(x,de) |
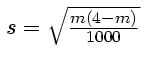
| s=sqrt(m*(4-m)/1000) |
| function
y=g(x); y=cos(2*%pi*x); endfunction |
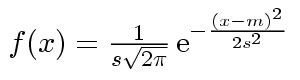
| fplot2d(2.97:0.001:3.31,f) |
| se=sqrt(variance(d)) |